

Image Details
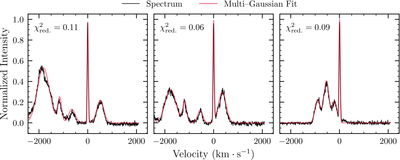
Caption: Figure 1.
Example fits to the spectra of the SNR 1E 0102.2-721 from three different IFUM spaxels within a 5″ radius of the expansion center. The broadened [O III] line is decomposed into individual Gaussian contributions using GaussFit. The IFUM data is shown in black and the total model output from GaussFit is in red.
Copyright and Terms & Conditions
© 2026. The Author(s). Published by the American Astronomical Society.

Copyright ©
2026 Astronomy Image Explorer. All Rights Reserved.
