

Image Details
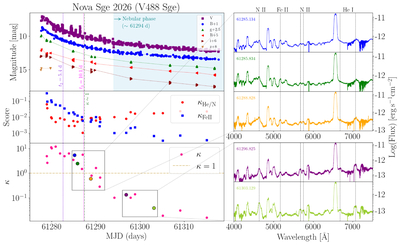
Caption: Figure 1.
(top-left) Light-curves provided by the American Association of Variable Star Observers (AAVSO) and (middle-left) time evolution of the κHe/N and κFe II scores and (bottom-left) κ coefficient of Nova Sge 2026. Vertical lines mark t2 (violet), t3 (pink), and the Fe II to He/N phase transition, while the nebular phase is highlighted in pale blue. (right) Examples of spectra of Nova Sge 2026 with κ > 1 (61285.13 and 61285.83 MJD), κ ≈ 1 (61288.83 MJD), and κ < 1 (61296.83 and 61303.13 MJD). The spectra have the same colors as the corresponding data points in the bottom-left panel. The vertical dotted lines mark the wavelength of the He, N, and Fe II lines used to compute κ.
Copyright and Terms & Conditions
© 2026. The Author(s). Published by the American Astronomical Society.

