

Image Details
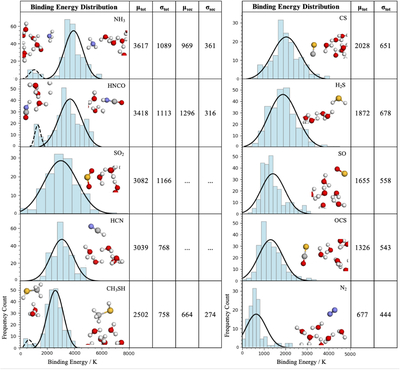
Caption: Figure 1.
Binding energy distributions and binding modes for ten N- and S-bearing species on the 15 ASW12 clusters, ordered from the most strongly to the most weakly bound. The solid black curves show fits to the full BE distributions, characterized by μtot and σtot. Where a distinct secondary binding mode is present, its fit is shown by a dashed black curve and characterized by μsec and σsec. All binding energies are given in K.
Copyright and Terms & Conditions
© 2026. The Author(s). Published by the American Astronomical Society.

Copyright ©
2026 Astronomy Image Explorer. All Rights Reserved.
