

Image Details
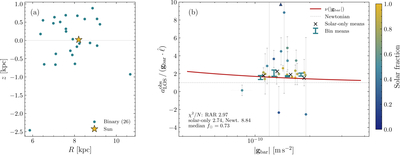
Caption: Figure 1.
(a) Galactocentric positions of the binary pulsar sample (circles). (b) Boost ratio ﹩{a}_{{\rm{LOS}}}^{{\rm{obs}}}/({{\boldsymbol{g}}}_{{\rm{bar}}}\cdot \hat{{\boldsymbol{\ell }}})﹩ versus ∣gbar∣. The red curve is the Simple RAR fit to galaxy rotation curves and the gray line is Newtonian. Points are colored by the fraction of acceleration magnitude that is from the Solar acceleration. The cyan error bars show inverse-variance-weighted means in equally spaced bins in ﹩{{\mathrm{log}}}_{10}{g}_{{\rm{bar}}}﹩ (only bins with two or more pulsars are shown). The black crosses show the Solar-only bin means (i.e., setting the measured differential acceleration to zero). Triangles mark points clipped beyond the plotting range.
Copyright and Terms & Conditions
© 2026. The Author(s). Published by the American Astronomical Society.

