

Image Details
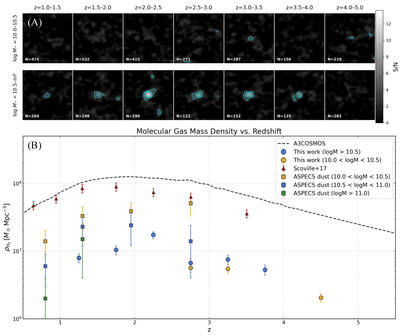
Caption: Figure 1.
(A) Stacked 15″ × 15″ radio continuum images by redshift (z = 1.0–5.0, columns) and stellar mass (rows). The top row shows ﹩10.0\lt {\mathrm{log}}({M}_{* }/{M}_{\odot })\lt 10.5﹩ and the bottom row ﹩{\mathrm{log}}({M}_{* }/{M}_{\odot })\gt 10.5﹩. Each panel indicates the number of sources (N). Grayscale shows the signal-to-noise ratio. (B) Cosmic molecular gas mass density (﹩{\rho }_{{{\rm{H}}}_{2}}﹩) versus redshift. Circles show our results for ﹩10.0\lt {\mathrm{log}}({M}_{* }/{M}_{\odot })\lt 10.5﹩ (gold) and ﹩{\mathrm{log}}({M}_{* }/{M}_{\odot })\gt 10.5﹩ (blue), with 1σ bootstrap errors. Comparisons include A3COSMOS (dashed line), N. Scoville et al. (2017) (triangles), and ASPECS (squares).
Copyright and Terms & Conditions
© 2026. The Author(s). Published by the American Astronomical Society.

