

Image Details
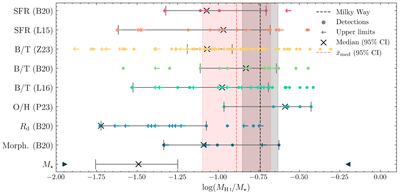
Caption: Figure 1.
Comparison of fH I between MWAs and the MW (black dashed line and shaded CI). For all samples, we show median (crosses) and 95% CI (horizontal lines). For most samples, individual MWA galaxy measurements are overlaid with detections (dots) and upper limits (left arrows); we show only the range (filled triangles) for the large M⋆-matched sample. The red dashed line show the weighted mean of all medians.
Copyright and Terms & Conditions
© 2026 The Author(s). Published by the American Astronomical Society. The Author(s). Published on behalf of The Electrochemical Society by IOP Publishing Limited

Copyright ©
2026 Astronomy Image Explorer. All Rights Reserved.
