

Image Details
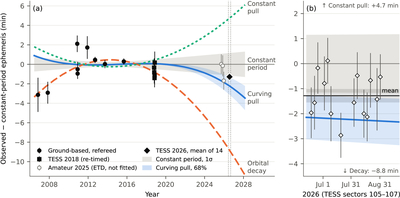
Caption: Figure 1.
(a) Transit times minus the constant-period ephemeris of the 14 refereed 2006–2018 times; gray band: its 1σ extrapolation. Circles: ground-based times; squares: TESS 2018, re-timed here; diamond: mean of the 14 TESS 2026 transits; open circles: unrefereed 2025 times from the Exoplanet Transit Database (ETD), not fitted. Curves: decay at −71.76 ms yr−1 (dashed), constant +37.8 m s−1 yr−1 acceleration (“constant pull,” dotted), and the curving RV trend (“curving pull,” solid; 68% band from the RV fit, extrapolated after 2013). (b) The 2026 window (vertical dotted lines in (a)): single transits, their mean (±1σ) and off-scale predictions.
Copyright and Terms & Conditions
© 2026. The Author(s). Published by the American Astronomical Society.

