

Image Details
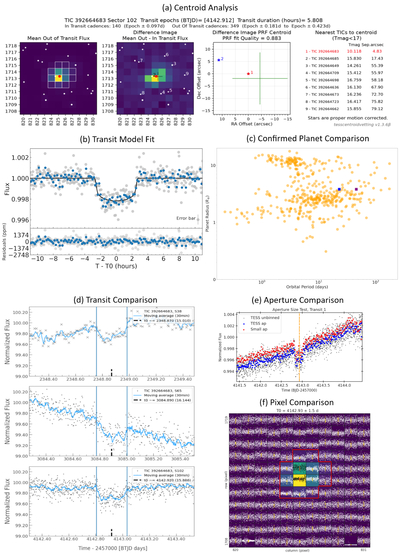
Caption: Figure 1.
Transit validation and modeling for TIC 392664683. (a) In-transit centroid analysis for Sector 102. (b) The transit model fit from pyaneti. Blue dots: 10 minute binned. (c) Candidate plotted at both possible periods (square markers) for planet-hosting orange dwarfs between 0.65 and 0.9 R⊙ where planetary masses have been measured. (d) Comparison between the three observed transits (PDCSAP). (e) Comparison between the pipeline aperture (blue) and an aperture 40% smaller (red). (f) Light curves for each pixel in the SPOC pipeline mask.
Copyright and Terms & Conditions
© 2026. The Author(s). Published by the American Astronomical Society.

Copyright ©
2026 Astronomy Image Explorer. All Rights Reserved.
