

Image Details
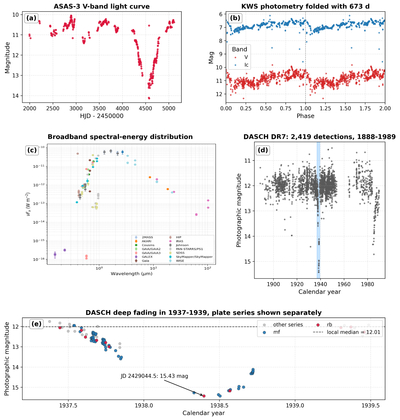
Caption: Figure 1.
Photometric evidence for the DY Per classification. (a) ASAS-3 V photometry, including the deep 2008 fading. (b) KWS photometry folded with 673 days in both V and Ic bands. (c) Broadband spectral-energy distribution, showing the infrared excess. Panels (a)–(c) summarize the analysis first presented in our EAS 2025 poster. (d) All 2419 DASCH DR7 calibrated detections; the shaded region marks the historical event. (e) The 1937–1939 decline, with plate series shown separately and the adjacent-interval median marked by a dashed line. Magnitude axes are inverted.
Copyright and Terms & Conditions
© 2026. The Author(s). Published by the American Astronomical Society.

Copyright ©
2026 Astronomy Image Explorer. All Rights Reserved.
