

Image Details
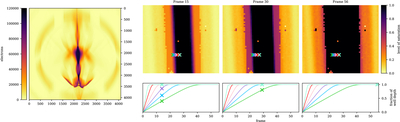
Caption: Figure 1.
(Left) View of the final frame of the SCA 5, 3.4 mag data. The Roman grism disperses light into multiple diffraction orders (e.g., (0,0), (1,1)), with most of the light concentrated in the primary (1,1) order used for science spectra. The extreme brightness of the simulated source reveals the diffuse structure of the additional diffraction orders surrounding the saturated (1,1) trace. The color scale is normalized to the detector saturation limit. The faint, broken ring surrounding the grism structure is scattered light from the telescope simulator and is not expected in flight data. (Right) Progression of saturation in the SCA 8, 7.8 mag data. The top panels show zoomed-in images of the primary (1,1) grism trace at frames 15, 30, and 56, from left to right. Colored “X” symbols mark neighboring pixels spaced one pixel apart, and the corresponding bottom panels show the accumulation of charge in these pixels throughout the exposure. The “X” symbols on the curves indicate the charge accumulated at the frame shown above. Pixels close to the center of the trace saturate very quickly, in only a few frames and then the extent of saturation grows over time as more charge is accumulated. A pixel reaches saturation at the point where its curve plateaus.
Copyright and Terms & Conditions
© 2026. The Author(s). Published by the American Astronomical Society.

