

Image Details
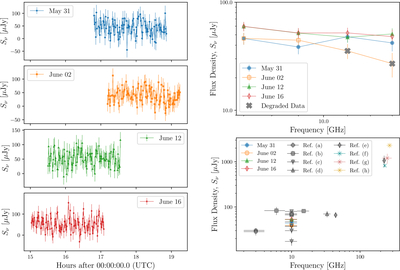
Caption: Figure 1.
(Left:) Total light curves in 1 minute time bins per epoch. While ϵ Eri is detected in quiescence, there are no clear enhancements, and the light curve is not intrinsically variable. (Upper right:) Spectra of ϵ Eri per epoch over 8–12 GHz are flat within error. Data from May 31 to June 2 are affected by phase instabilities. The most notable degradations are noted by gray Xs. There is a slight variation in Sν between dates, but it is not statistically significant. The data for this panel and the light curves is available in machine readable format in the .tar.gz package. (Lower right:) Average Sν per epoch compared to past >1 GHz observations. References: (a) A. Suresh et al. (2020), (b) T. S. Bastian et al. (2018), (c) L. F. Rodríguez et al. (2023), (d) L. F. Rodríguez et al. (2019), (e) M. A. MacGregor et al. (2015), (f) M. Booth et al. (2017), (g) J.-F. Lestrade & E. Thilliez (2015), (h) M. Chavez-Dagostino et al. (2016).
(The data used to create this figure are available in the online article.)
(The data used to create this figure are available.)
Copyright and Terms & Conditions
© 2026. The Author(s). Published by the American Astronomical Society.

