

Image Details
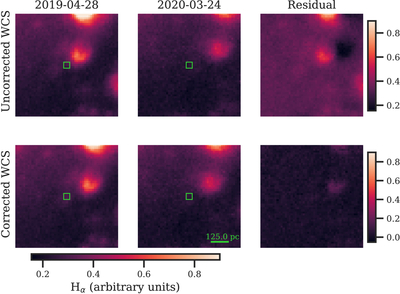
Caption: Figure 1.
Plots of Hα emission density in the region around SN 2019ehk. The images in order from left to right show the pre-explosion data, late-time data, and the difference between these two. The green square marks a 3 × 3 array of pixels at the location of SN 2019ehk. In the corrected version (bottom row), does not show a dipole in the difference image.
Copyright and Terms & Conditions
© 2026. The Author(s). Published by the American Astronomical Society.

Copyright ©
2026 Astronomy Image Explorer. All Rights Reserved.
