

Image Details
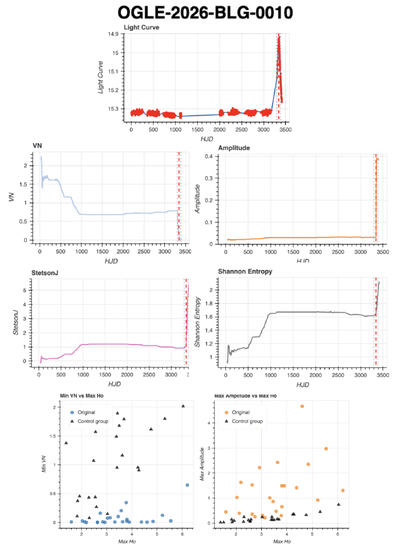
Caption: Figure 1.
Four parameter versus time and two min/max plots for OGLE-2026-BLG-0010. HJD is calculated relative to the start time of each OGLE time series dataset. Projected event timescales from OGLE EWS parameter data can be seen in the dashed lines on each plot (A. Udalski et al. 1994).
Copyright and Terms & Conditions
© 2026. The Author(s). Published by the American Astronomical Society.

Copyright ©
2026 Astronomy Image Explorer. All Rights Reserved.
