

Image Details
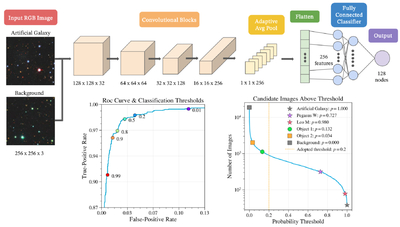
Caption: Figure 1.
Top: schematic of the CNN architecture. Each block indicates the spatial dimensions and number of feature maps at each stage. Lower left: ROC curve on the test set. Because the curve lies close to the ideal upper-left corner, only a zoomed-in view is shown. Several classification thresholds are labeled. Bottom right: number of UFD candidates above each classification threshold for 48,000 real images from an over-density search. The gray star and square indicate the predicted probabilities of the artificial galaxy and background images shown at the top left of the figure. Predictions for several additional sources are also plotted: Pegasus W and Leo M are known galaxies (K. B. W. McQuinn et al. 2023, 2024), Object 1 is a confirmed star cluster or galaxy, and Object 2 is a confirmed non-detection.
Copyright and Terms & Conditions
© 2026. The Author(s). Published by the American Astronomical Society.

