

Image Details
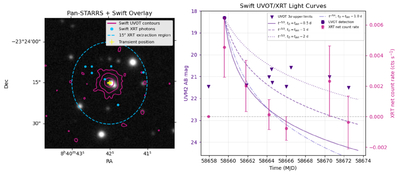
Caption: Figure 1.
Left: Pan-STARRS i-band image of the host galaxy. Magenta contours show Swift UVOT UVM2 emission, corresponding to the 95th, 98th, and 99.5th percentile levels of the UV image. Cyan points indicate the positions of Swift XRT photons in the 0.3–10 keV band, and the yellow cross marks the transient position. The dashed cyan circle denotes the 15″ Swift XRT source extraction region. The scatter of the XRT photons reflects the Swift XRT point-spread function; the photon distribution is nonetheless consistent with a nuclear source. Right: Swift UVOT UVM2 and XRT light curves of the transient. The UV flare was detected at mAB ≈ 18.3. Purple triangles denote 3σ upper limits from non-detections. Magenta points show the measured XRT net count rates and 1σ uncertainties. Overplotted curves illustrate representative t−5/3 or t−9/4 decline models for complete or partial TDEs, respectively, each anchored to a different assumed disruption time. The rapid fading and subsequent upper limits are consistent with a short-lived nuclear transient.
Copyright and Terms & Conditions
© 2026. The Author(s). Published by the American Astronomical Society.

