

Image Details
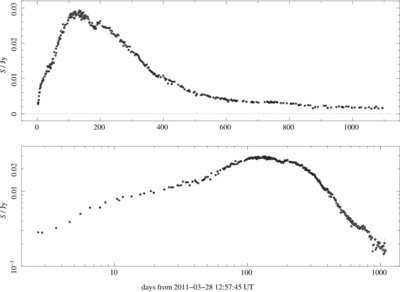
Caption: Figure 1.
Radio light curve of Swift J164449.3+573451 at 15.5 GHz from 2011 March to 2014 March from AMI observations, plotted linearly (top panel) and logarithmically (bottom panel). Each data point is a the average from an observation. Statistical error bars are plotted, although these are usually smaller than the size of symbols.
(The data used to create this figure are available in the online article.)
(The data used to create this figure are available.)
Copyright and Terms & Conditions
© 2026. The Author(s). Published by the American Astronomical Society.

Copyright ©
2026 Astronomy Image Explorer. All Rights Reserved.
