

Image Details
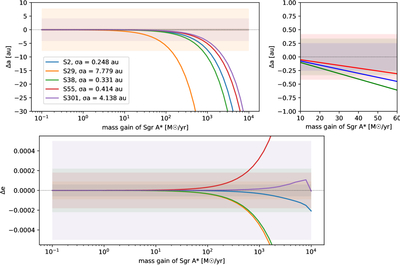
Caption: Figure 1.
Top: change in each S-star’s semimajor axis as a function of the imposed mass-growth rate of Sgr A*. The colored bands show the published 1σ uncertainties in the corresponding semimajor axes (GRAVITY Collaboration et al. 2024; S. Gillessen 2026). The left-hand panel shows all stars; the right-hand panel zooms in on the region where S2, S38, and S55 cross their respective uncertainty bands. Bottom: corresponding change in each S-star’s eccentricity.
Copyright and Terms & Conditions
© 2026. The Author(s). Published by the American Astronomical Society.

Copyright ©
2026 Astronomy Image Explorer. All Rights Reserved.
