

Image Details
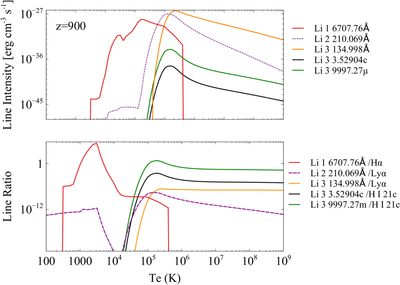
Caption: Figure 1.
Predicted lithium emission for the z = 900 model. The top panel shows absolute Li line intensities, the volume emissivity 4πj, while the bottom panel shows ratios relative to representative hydrogen lines. The z = 100 case has a similar temperature dependence and line ordering, but is about six orders of magnitude weaker in absolute intensity.
Copyright and Terms & Conditions
© 2026. The Author(s). Published by the American Astronomical Society.

Copyright ©
2026 Astronomy Image Explorer. All Rights Reserved.
