

Image Details
Caption: Figure 1.
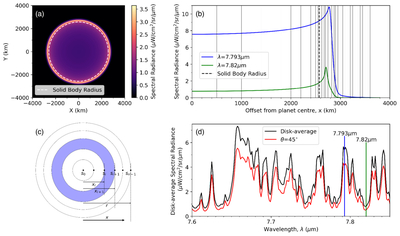
Example disk-average spectrum of Titan (R = 2575 km). (a) Modeled emission at 7.82 μm. (b) Center-to-limb radiance variation at two example wavelengths. Note significant off-limb emission. (c) Schematic of notation used in this research note. (d) Disk-average spectrum with n = 40 compared to a modeled 45∘ emission angle spectrum. Vertical lines in (b) indicate the 40-point x grid. The data and code behind this figure are available.
(The data used to create this figure are available in the online article.)
(The data used to create this figure are available.)
Copyright and Terms & Conditions
© 2026. The Author(s). Published by the American Astronomical Society.

Copyright ©
2026 Astronomy Image Explorer. All Rights Reserved.
