

Image Details
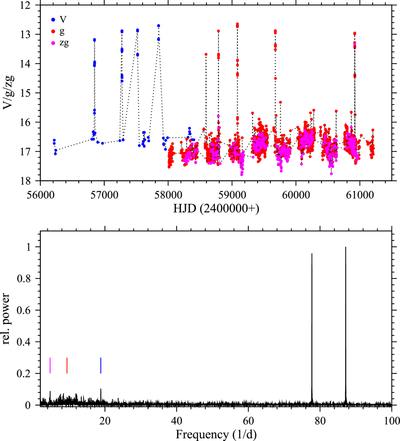
Caption: Figure 1.
Top: long-term light curve of ASASSN-14ds. The blue and red dots are ASAS-SN V- and g-band magnitudes, respectively. The magenta dots are ZTF zg-band data. Bottom: periodogram of the TESS light curve of ASASSN-14ds, dominated by signals at the WD spin frequency and its negative orbital side band. The red, blue and magenta vertical bars indicate the orbital frequency, its first harmonic and its subharmonic.
Copyright and Terms & Conditions
© 2026. The Author(s). Published by the American Astronomical Society.

Copyright ©
2026 Astronomy Image Explorer. All Rights Reserved.
