

Image Details
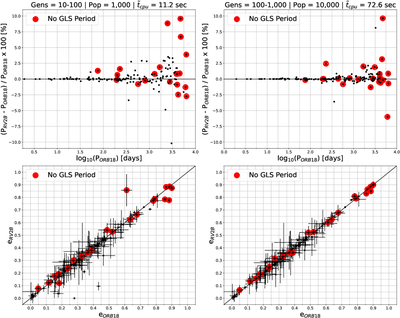
Caption: Figure 1.
Comparison of orbital periods (top) and orbital eccentricities (bottom) between RV2B and ORB18 values reported in D. W. Latham et al. (2002). Left and right columns display results with different GA generation and population hyperparameters, which are displayed over the figure along with the median CPU runtimes. For clarity, the period differences are shown in terms of percent error of ORB18 values. Red circles highlight where RV2B does not use a GLS period, and black lines bisecting the panels are one-to-one lines.
Copyright and Terms & Conditions
© 2026. The Author(s). Published by the American Astronomical Society.

Copyright ©
2026 Astronomy Image Explorer. All Rights Reserved.
