Image Details
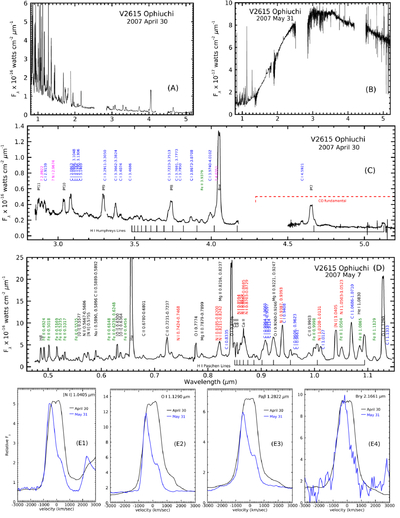
Caption: Figure 1.
Select portions of spectra from three epochs of the dust-forming nova V2615 Ophiuchi. (A) and (B) show the full 0.8–5.2 μm spectra from before and after dust formation, highlighting the spectral transformation caused by thermal dust emission. Our best fit value of the dust temperature on May 31 is 970 K ± 20 K. (C) shows the mid-wave infrared portion of the spectrum from April 30. The dashed red line shows where the CO fundamental would appear if it were present. Emission lines in this spectral range are predominantly H I and C I. (D) presents optical data approximately one month later than the observations of Munari et al. (2009) and includes the 0.8–1.08 μm spectral portion not covered by the concurrent spectrum of R. K. Das et al. (2009). (E1) through (E4) contrast profiles of some of the stronger emission lines from before and after dust formation illustrating the significant changes affecting the red half of the lines. Zero velocity in these plots corresponds to the laboratory vacuum wavelength of the given line.
(The data used to create this figure are available in the online article.)
(The data used to create this figure are available.)
Copyright and Terms & Conditions
© 2026. The Author(s). Published by the American Astronomical Society.