Image Details
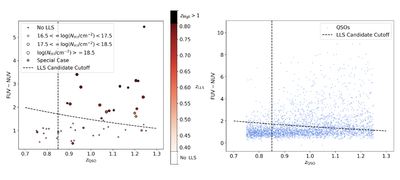
Caption: Figure 1.
The left panel shows FUV − NUV color versus quasar redshift for the 55 SDSS quasars with archival COS G140L spectra. The colorbar on the right encodes the redshift of any Lyman Limit and partial Lyman Limit Systems detected in the UV spectra of each quasar, and symbol size encodes the estimated H I column density, as indicated in the legend, with the smallest symbol size used for quasars with no detected pLLS or LLS in their UV spectra. In a few cases, the COS spectra show very low flux levels, likely due to the presence of LLS breaks redward of the spectral coverage, which we confirmed with the presence of Mg II absorption at z > 1 in the SDSS optical spectra. These systems are shown in black, as indicated in the colorbar. Based on the general trend of the quasars with Lyman breaks being at a higher redshift and stronger FUV − NUV, a rough estimate for the minimal values needed to be a Lyman jump candidate is shown with the dashed line. The right panel represents all quasars from SDSS DR16 at redshift 0.75 < z < 1.25 and a NUV ≤ 19, with the same parameters on the x and y axes and dashed cutoff lines as the left panel. All quasars to the upper right of the dashed lines represent LLS candidates, indicated by their unusually red FUV − NUV color. The candidate LLS sightlines are included in the data behind the figure file as a machine-readable table.
(The data used to create this figure are available in the online article.)
(The data used to create this figure are available.)
Copyright and Terms & Conditions
© 2026. The Author(s). Published by the American Astronomical Society.