Image Details
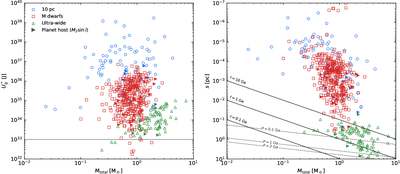
Caption: Figure 1.
Reduced binding energy (left) and projected physical separation (right) as a function of system total mass. Blue circles represent pairs in the solar neighborhood (J. González-Payo et al. 2026), red squares M-dwarfs pairs (C. Cifuentes et al. 2025), and green upward-facing triangles ultra-wide pairs (J. González-Payo et al. 2023). The filled right-facing triangles are the systems containing known planets. The left panel includes a horizontal line at the ﹩| {U}_{g}^{* }| ﹩ at 1033 J limit. Near this limit, ultra-wide and M-dwarf pairs overlap, as the latter extend to large separations and comparable fragility. In the right panel, solid diagonal lines mark disruption timescales of 0.1, 1, and 10 Ga, while dashed lines indicate orbital periods of 0.1, 1, and 2 Ga. The dataset used to generate this figure is available in machine-readable format in the online journal.
(The data used to create this figure are available in the online article.)
(The data used to create this figure are available.)
Copyright and Terms & Conditions
© 2026. The Author(s). Published by the American Astronomical Society.