Image Details
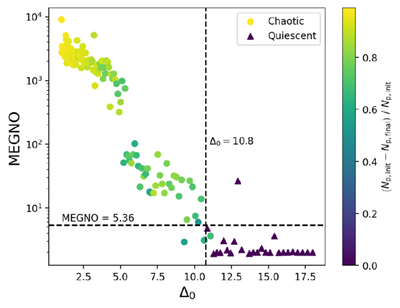
Caption: Figure 1.
MEGNO indicator for each simulation with differing initial embryo spacing (Δ0), colored by the fraction of embryos that remained after 30 Myr. Circles represent “chaotic” simulations in which at least 20% of initial bodies experienced a collision, and triangles represent “quiescent” simulations. The dashed lines at MEGNO = 5.36 and Δ0 = 10.8 mark the classifier cuts from the trained decision tree.
Copyright and Terms & Conditions
© 2026. The Author(s). Published by the American Astronomical Society.
Copyright ©
2026 Astronomy Image Explorer. All Rights Reserved.