Image Details
Caption: Figure 1.
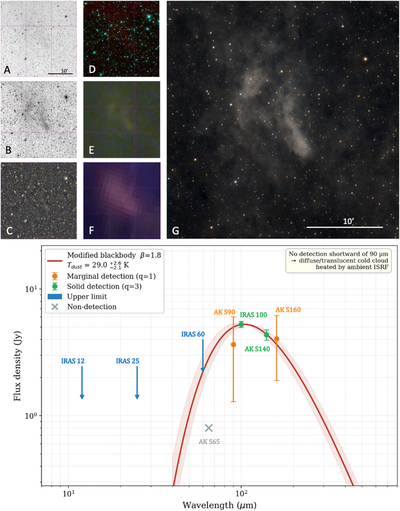
Multi-wavelength identification of IRAS 19448−0234 as an extended dust cloud candidate. Left panels: archival survey data. DSS2 blue (A), DSS2 red (B), PanSTARRS DR1 colour composite (g, z bands) (C), AllWISE colour composite (Blue/W1, 3.4 μm, Green/W2, 4.6 μm, Red/W4, 22 μm) (D), AKARI FIS colour composite (N60 65 μm, WIDE-S 90 μm, WIDE-L 140 μm) (E), IRAS-IRIS 100 μm (F). All survey panels are similarly oriented covering the same field centred on R.A. 19h47m30s, decl. −02°27′07″ (J2000). DSS2 optical panels are shown with inverted greyscale. A scale bar of 10′ is shown in panel (A), that applies to panels (A)–(F). Right panel: deep optical image obtained by the author. A 10′ scale bar is applied. (G). To generate this image, 147″ × 600″ subexposures (total of 24h30′) were acquired with a William Optics 132 FLT, f/7, 925 mm focal, refractor and a ZWO ASI2600 MC Pro one-shot colour CMOS camera, through a Optolong L-Quad Enhance filter, on a iOptron CEM70EC mount, from a Bortle 4.5 location. Data and image processing was performed with Siril and PixInsght software packages. Bottom panel: spectral energy distribution. Filled circles show flux densities from the IRAS FSC and AKARI FIS catalogs; green and orange symbols indicate solid (q = 3) and marginal (q = 1) detections respectively. Downward arrows are 3σ upper limits; the cross at 65 μm is a non-detection. The red curve is the best-fit modified blackbody (β = 1.8; Tdust = 29.0 + 2.6/−2.1 K, 1σ shaded band). No detections shortward of 90 μm indicate cold quiescent dust with no embedded heating source.
Copyright and Terms & Conditions
© 2026. The Author(s). Published by the American Astronomical Society.