Image Details
Caption: Figure 1.
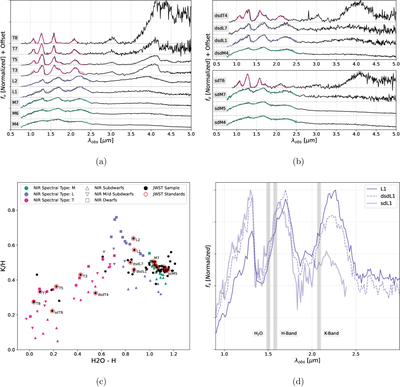
(a) and (b) JWST/NIRSpec Prism spectral standards for M, L, and T dwarfs (a) and subdwarfs (b), plotted in fν flux density units (black lines). Spectra are normalized in the 1–2 μm region and offset by constants. Spectral types based on the best-match NIR standards (overplotted color lines) are listed along the left side. (c) Comparison of spectral indices H2O–H and K/H for ground-based spectral standards (colored symbols) and JWST/NIRSpec Prism spectra (black dots). Selected NIRSpec standards are encircled and labeled. For the NIR standards, symbol colors indicate spectral class (M dwarf = green, L dwarf = blue, T dwarf = magenta), while symbol shapes indicate metallicity class (dwarf = squares, d/sd = inverted triangle, sd = triangles). (d) JWST/NIRSpec Prism spectra of our L1 (solid blue line) and d/sdL1 (dashed blue line) standards, compared to the NIR sdL1 standard (faded blue line; A. J. Burgasser et al. 2025) over 0.9–3.0 μm. Shaded bands indicate the regions sampled for the H2O–H (H2O over H-band) and K/H (K-band over H-band) indices.
(The data used to create this figure are available in the online article.)
(The data used to create this figure are available.)
Copyright and Terms & Conditions
© 2026. The Author(s). Published by the American Astronomical Society.