Image Details
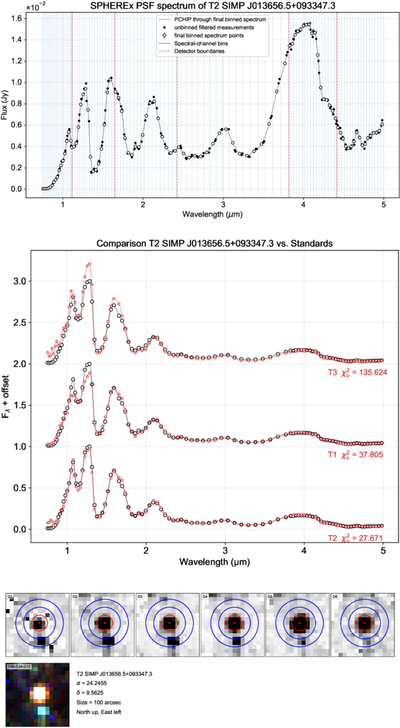
Caption: Figure 1.
Example SPExPI products for the T2 brown dwarf SIMP J013656.5+093347.3. Top: SPHEREx PSF-extracted spectrum. Black points show unbinned measurements, open black circles the final binned spectrum, and the gray curve a PCHIP interpolation through the final spectrum. Vertical blue lines indicate spectral channel boundaries and dashed red lines indicate detector boundaries. Middle: comparison against brown-dwarf spectral standards, showing best agreement with the T2 standard. Bottom: detector-stacked SPHEREx image mosaic generated with the SPExPI image-stacking tools.
Copyright and Terms & Conditions
© 2026. The Author(s). Published by the American Astronomical Society.
Copyright ©
2026 Astronomy Image Explorer. All Rights Reserved.