Image Details
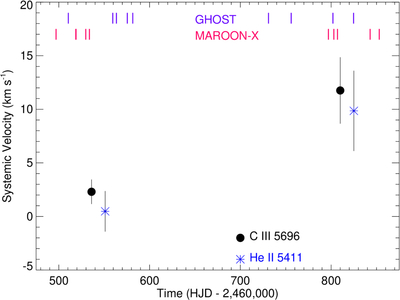
Caption: Figure 1.
Here we plot the systemic velocity of CV Ser both for the WR star (C III 5696, black circles) and the O star (He II 5411, blue asterisks) compared to the average date for each calendar year’s observation time. We include the times of the individual observations for both GHOST and MAROON-X at the top of the plot. The points for the two lines measured are separated by 15 d of time for clarity.
Copyright and Terms & Conditions
© 2026. The Author(s). Published by the American Astronomical Society.
Copyright ©
2026 Astronomy Image Explorer. All Rights Reserved.