Image Details
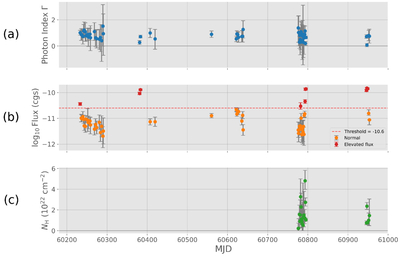
Caption: Figure 1.
Long-term Swift/XRT monitoring results for IGR J06074+2205. Panels show the best-fit photon index Γ (a), unabsorbed 0.3–10 keV flux (b)—red points indicate flux-elevated observations (log10F > −10.6 cgs) and orange points denote quiescent-level detections; the red dashed line marks the threshold—and intrinsic column density NH (1022 cm−2) (c), all as a function of MJD. Shaded regions in panel (b) mark four flux-elevated intervals: MJD 60233, 60381–60420, 60776–60800, and 60946–60950. The data used to construct this figure are provided in machine-readable form in the online journal.
(The data used to create this figure are available in the online article.)
(The data used to create this figure are available.)
Copyright and Terms & Conditions
© 2026. The Author(s). Published by the American Astronomical Society.