Image Details
Caption: Figure 1.
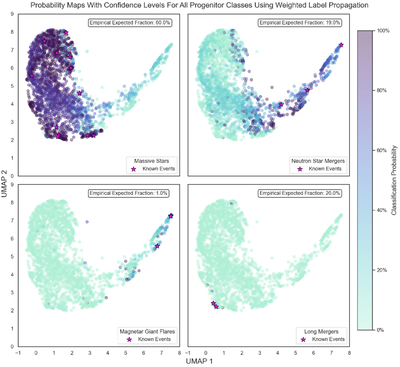
2D embedding of GRBs obtained with UMAP. Each panel corresponds to a different class (top left: MS, top right: NSM, bottom left: MGF, bottom right: LM), with the colorbar indicating the classification probability assigned by the label propagation algorithm after reweighting. Pink stars mark the known events used as the labeled sample during training. There is also a 3D version (https://grb-smartwaterfall-explorer.vercel.app/) of this plot.
Copyright and Terms & Conditions
© 2026. The Author(s). Published by the American Astronomical Society.
Copyright ©
2026 Astronomy Image Explorer. All Rights Reserved.