Image Details
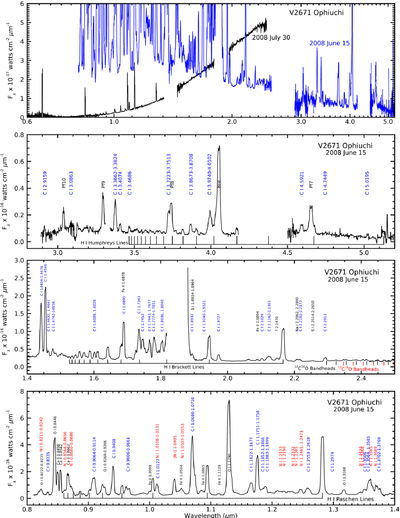
Caption: Figure 1.
Spectra of the nova V2671 Ophiuchi from before and after dust formation with the top panel showing the full spectra from both epochs. The first epoch, from 15 days after peak brightness and prior to dust formation, is pictured in detail in the lower three panels. The numerous C I lines are labeled in blue and the N I lines in red. The brightest emission line is O I 1.1290 μm. It, and its counterpart O I 0.8446 μm, are fluorescently excited by H I Lyβ. The focus of the top panel is the spectrum from 60 days after maximum brightness and after dust formation. It includes the earlier data (plotted in blue) to highlight the spectral changes caused by dust formation. Due to space constraints, the emission lines are not labeled for the July 30 spectrum but they are primarily from H I and He I. The second panel from the bottom shows the first overtone CO emission. The bandheads for 12C16O are marked in black while those of 13C16O are highlighted in red. The CO first overtone emission is seen in better contrast in the top panel; the CO fundamental is detectable as the slight rise followed by a steep decline in brightness in the spectrum beyond 4.5 μm.
(The data used to create this figure are available in the online article.)
(The data used to create this figure are available.)
Copyright and Terms & Conditions
© 2026. The Author(s). Published by the American Astronomical Society.