Image Details
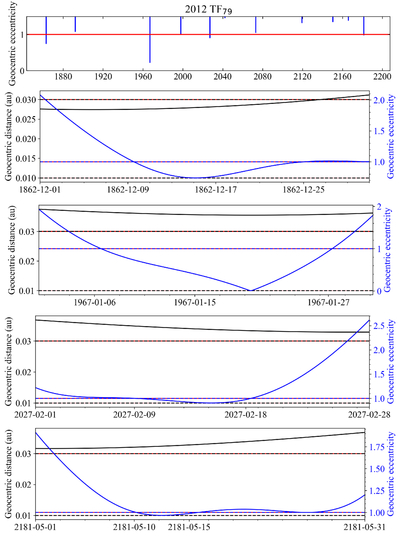
Caption: Figure 1.
Evolution of the geocentric eccentricity of 2012 TF79 from 1860 January 1 to 2190 December 31 (top). The other four panels show the time evolution of the geocentric eccentricity (blue) and distance (black) during the capture events discussed in the text. The one Hill radius mark is shown in black–pink, the three Hill radii in black–red, and the eccentricity equal to 1 in red/blue–red. The source of the data is JPL’s Horizons. The output interval is 130 hr for the top panel and 600 s for the others.
Copyright and Terms & Conditions
© 2026. The Author(s). Published by the American Astronomical Society.
Copyright ©
2026 Astronomy Image Explorer. All Rights Reserved.