Image Details
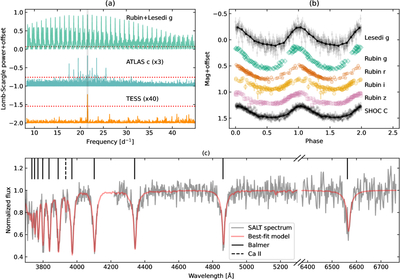
Caption: Figure 1.
Analysis of LSST, Lesedi, SHOC, and SALT observations of J035129.2−482323. (a) Lomb–Scargle analysis of the combined g-band observations from LSST and Lesedi, ATLAS c band, and TESS Sector 31, from top to bottom, scaled as shown. The horizontal dotted lines represent the 3σ noise. The vertical line represents the best period. (b) multi-color phase-folded light curves from Lesedi, SHOC, and LSST. (c) the normalized SALT spectrum (gray) and best-fit model (red). Balmer lines and Ca II 3933.7 Å are marked by vertical lines.
Copyright and Terms & Conditions
© 2026. The Author(s). Published by the American Astronomical Society.
Copyright ©
2026 Astronomy Image Explorer. All Rights Reserved.