Image Details
Caption: Figure 1.
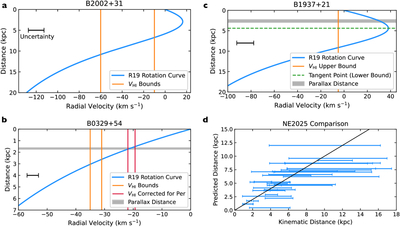
(a) Distance versus radial velocity for PSR B2002+31. The R19 rotation curve model is shown in blue, and orange lines indicate the measured H I velocity (VHI) bounds. A black errorbar indicates the magnitude of velocity uncertainty assumed due to random motions of H I clouds. (b) Same as (a) for PSR B0329+54. Red lines indicate the velocity bounds corrected for peculiar motions in the Perseus arm. The independently measured parallax distance is shown in gray. (c) Same as (a), (b) for PSR B1937+21. In this case the lower velocity bound is at the tangent point, indicated by the dashed green line. (d) Distances predicted by NE2025 versus kinematic distances inferred in this work.
Copyright and Terms & Conditions
© 2026. The Author(s). Published by the American Astronomical Society.