Image Details
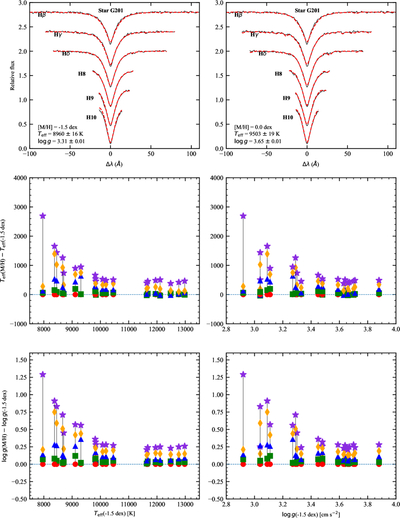
Caption: Figure 1.
Top: an example, for one star, of the observed spectrum (solid curve) with the best PHOENIX synthetic spectrum (dashed curve) for the metallicities [M/H] = −1.5 and 0.0 dex. The Balmer lines considered for the analysis are identified on the plots along with the best fit parameters. Middle and bottom: for all the stars, difference of the spectroscopic parameters obtained for the various metallicities with those obtained at [M/H] = −1.5 dex as a function of the effective temperature or surface gravity obtained at [M/H] = −1.5 dex. The circles and stars represent results for [M/H] = −1.5 dex and +0.5 dex respectively, while the squares, triangles, and diamonds indicates results for intermediate values of [M/H]. Error bars are not shown for clarity, they are of the order of 250 K along the temperature axis and of 0.08 dex along the log g axis.
Copyright and Terms & Conditions
© 2026. The Author(s). Published by the American Astronomical Society.