Image Details
Caption: Figure 1.
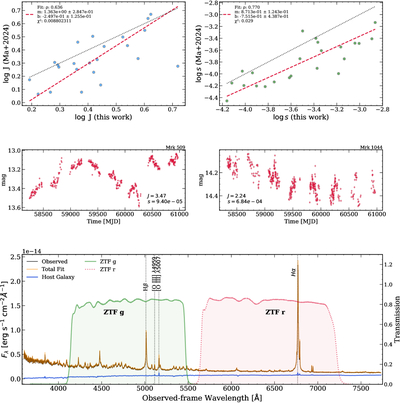
Upper left: ZTF DR24 measurements of J against those from MA24. The red line shows our fitted linear model obtained via Orthogonal distance regression (ODR), while the black line shows the 1:1 relation. Spearman correlation coefficient ρ and fitted parameters are shown in the top left corner. Upper right: same as left panel, but for s. Middle panels: representative ZTF r band light curves. Left: “Assembled” source (high J, low s). Right: “Dispersed” source (low J, high s). Each panel shows the source name, J, and s. Bottom panel: spectral fitting of Mrk 493. The black curve presents the DESI spectrum, while our best PyQSOfit is shown in orange. The derived host galaxy contribution is shown in blue. Green (solid) and red (dotted) lines show the transmission curves of ZTF for g and r, respectively. The transmission values are plotted on a secondary y-axis on the right. We marked the position of the strongest emission lines on each band with vertical dashed lines and text.
Copyright and Terms & Conditions
© 2026. The Author(s). Published by the American Astronomical Society.