Image Details
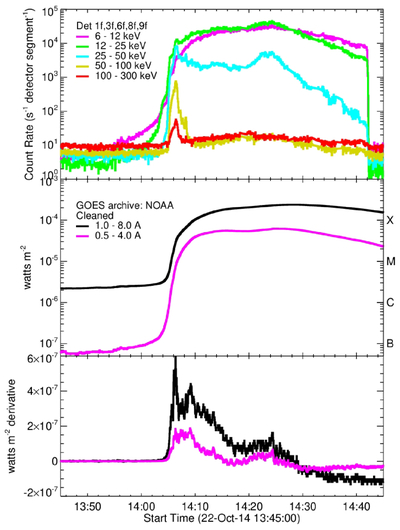
Caption: Figure 1.
GOES SXR and RHESSI HXR light curves for SOL2014-10-22T14:02. The 25–50 keV light curve (cyan) shows three peaks suggestive of three separate episodes of particle acceleration possibly on different loops as indicated by the different locations of the sources imaged with RHESSI at these times. Thus, more realistic values for Δt might be the times between the HXR peaks, i.e., at least a factor 2 shorter than the value used by S. M. Perriyil et al. (2026) in their Figures 4–6. This would then increase the mean velocity of the up-flowing heated plasma derived from the least-squares fits to the points in these figures to be closer to 100 km s−1 and similar to the range of velocities derived from EUV line blueshifts (E. Antonucci et al. 1982).
Copyright and Terms & Conditions
© 2026. The Author(s). Published by the American Astronomical Society.