Image Details
Caption: Figure 1.
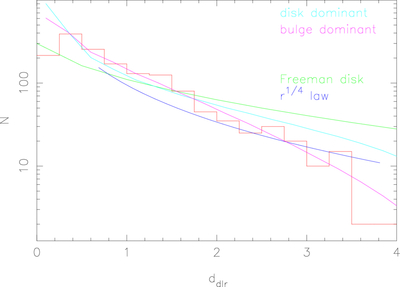
Radial distribution of SNe Ia in the Dark Energy Survey (in red). The green curve is the expectation for exponential disks and the blue curve for elliptical galaxies. These have not been normalized to the data. The other two curves are for DM triggered SNe, and these have been normalized to the same total number of SNe, excluding the first, central bin, which is anomalous, and is conceivably a selection effect of some SN being masked by the nucleus.
Copyright and Terms & Conditions
© 2026. The Author(s). Published by the American Astronomical Society.
Copyright ©
2026 Astronomy Image Explorer. All Rights Reserved.