Image Details
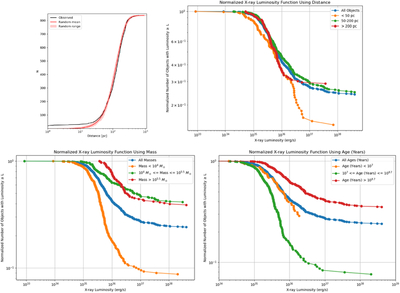
Caption: Figure 1.
Top Left: cumulative distribution diagram for the closest star cluster to XRBs. Black represents the data, while the red line corresponds to 1000 random simulations, with the red shaded region showing the 1σ error. Top Right: normalized X-ray Luminosity Function for 3 sets of XRB-cluster distance. Bottom Left: normalized X-ray Luminosity Function for 3 sets of cluster masses. Bottom Right: normalized X-ray Luminosity Function for 3 sets of cluster ages.
Copyright and Terms & Conditions
© 2026. The Author(s). Published by the American Astronomical Society.
Copyright ©
2026 Astronomy Image Explorer. All Rights Reserved.