Image Details
Caption: Figure 1.
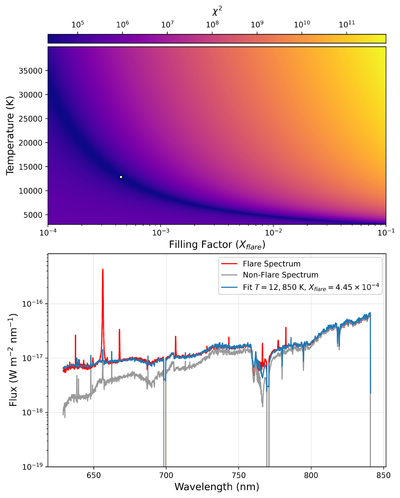
Top: χ2 parameter space illustrating the covariance between flare temperature and filling factor (﹩{X}_{{\rm{flare}}}﹩). A white dot represents the best-fit with T = 12,850 ± 25 K and a filling factor of 4.45 × 10⁻⁴. Bottom: the observed flaring spectrum (red) and non-flare spectrum (gray). The best-fit spectrum (blue) was calculated using data λ < 750 nm, with Hα and other atmospheric features masked during the fit.
Copyright and Terms & Conditions
© 2026. The Author(s). Published by the American Astronomical Society.
Copyright ©
2026 Astronomy Image Explorer. All Rights Reserved.