Image Details
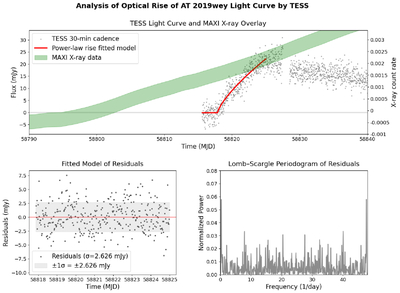
Caption: Figure 1.
Optical rise of AT 2019wey observed by TESS overlaid with Y. Yao et al. (2021b) model. (Top panel) Reduced TESS light curve of the AT 2019wey outburst observed in Sector 19. Gray dots are individual measurements from difference imaging on the TESS full-frame images, with the red being the power-law rise model. The red line is the best-fit piecewise power-law function fit to the rising light curve. The green shaded region indicates the best-fit MAXI X-ray evolution found by Y. Yao et al. (2021a). (Bottom left panel) Residuals of the TESS data after subtracting the best-fit model (red dashed line centered at zero) for the light curve rise. The gray shaded region shows the ±1σ standard deviation of the residuals. (Bottom right) Lomb–Scargle periodogram of the residuals shown in the bottom left panel.
Copyright and Terms & Conditions
© 2026. The Author(s). Published by the American Astronomical Society.