Image Details
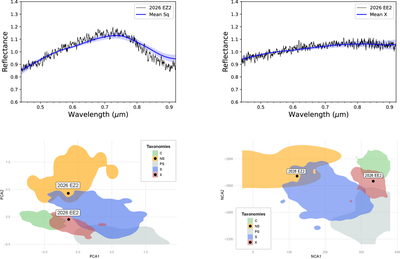
Caption: Figure 1.
Top panels: reflectance spectra of 2026 EE2 (left) and 2026 EZ2 (right), normalized to unity at 0.55 μm. The purple shaded region represents the mean spectrum ±1σ of the assigned taxonomic class from the e-SMASS database (E. Buendia et al. 2026). Bottom panels: PCA (left) and NCA (right) maps for 2026 EE2 and 2026 EZ2, showing the position of each asteroid (black dots) relative to the taxonomic classes in the e-SMASS database.
Copyright and Terms & Conditions
© 2026. The Author(s). Published by the American Astronomical Society.
Copyright ©
2026 Astronomy Image Explorer. All Rights Reserved.