Image Details
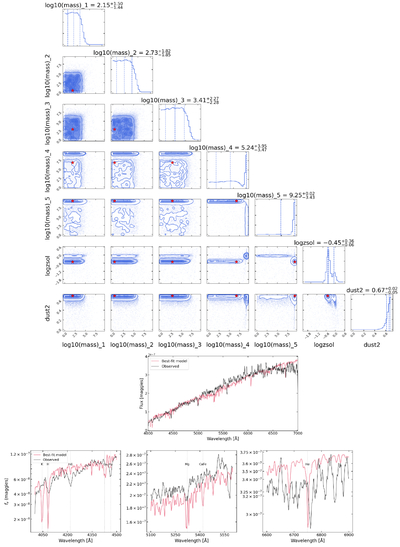
Caption: Figure 1.
Top: posterior distributions from the preferred non-parametric EMCEE SED fit for the five stellar-mass bins, metallicity, and dust attenuation. Red points mark maximum-likelihood estimates. Middle: observed Hectospec spectrum (gray) versus best-fit model (red), 4000–7000 Å. Bottom: zoomed views around key absorption features as labeled.
Copyright and Terms & Conditions
© 2026. The Author(s). Published by the American Astronomical Society.
Copyright ©
2026 Astronomy Image Explorer. All Rights Reserved.