Image Details
Caption: Figure 1.
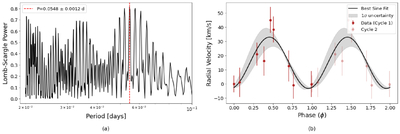
(a) Weighted Lomb–Scargle periodogram of the radial velocity measurements, showing a peak at P = 0.0548 day, marked by a red dashed line. (b) Phase-folded radial velocity curve using the derived period. The solid black line represents the best-fitting sinusoidal model, and the gray shaded region indicates the 1σ uncertainty of the fit. Error bars correspond to the estimated radial velocity uncertainties.
Copyright and Terms & Conditions
© 2026. The Author(s). Published by the American Astronomical Society.
Copyright ©
2026 Astronomy Image Explorer. All Rights Reserved.