Image Details
Caption: Figure 1.
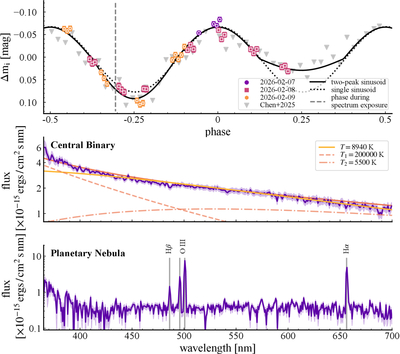
top: phase folded light curve of MPA J0705-1224. Observation nights are indicated by different markers and colors; the vertical dashed line marks the phase during the spectrum shown in the panels below. middle: spectrum of the binary (purple), fit with a single (yellow) and a double (orange) blackbody model, the two individual blackbody contributions to the double blackbody model are shown by the dashed and dashed–dotted lines. bottom: planetary nebula spectrum (purple), Hα, Hβ and the O III doublet emission lines are indicated.
Copyright and Terms & Conditions
© 2026. The Author(s). Published by the American Astronomical Society.
Copyright ©
2026 Astronomy Image Explorer. All Rights Reserved.