Image Details
Caption: Figure 1.
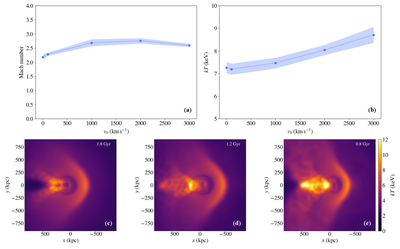
Shock properties as a function of the initial infall velocity. (a) Mach number of the shock front measured for initial velocities of 0, 100, 1000, 2000, and 3000 km s−1. (b) Post-shock gas temperature. Points indicate the average values obtained using two temporal windows (0.1 and 0.2 Gyr), while the shaded regions mark the range between them. (c)–(e) Gas temperature maps of the ICM showing the shock front for simulations with initial velocities of 100, 1000, and 2000 km s−1 at representative times within the analysis interval.
Copyright and Terms & Conditions
© 2026. The Author(s). Published by the American Astronomical Society.
Copyright ©
2026 Astronomy Image Explorer. All Rights Reserved.