Image Details
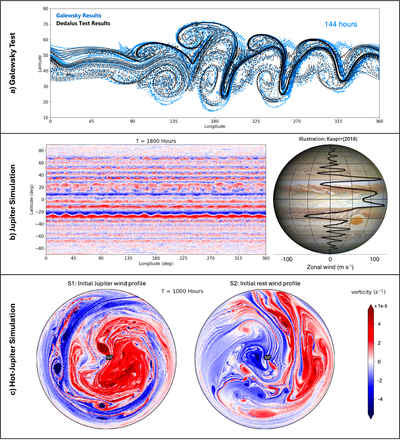
Caption: Figure 1.
Vorticity fields from T341 simulations. (a) DEDALUS and G04 with ν = 0 showing 2e-5 s−1 contour intervals; calculations match closely but not exactly. (b) Jupiter simulation with DEDALUS (left) initialized with the JWST zonal wind profile (right); jets and banding are stable on the large-scale. (c) Polar view of hot-Jupiter simulations with DEDALUS (at ∼40 “thermal” relaxation times), initialized with Jupiter’s zonal jets (left; S1) and rest (right; S2); the flows showcase the dependence on initial conditions and validate high-resolution simulations.
Copyright and Terms & Conditions
© 2026. The Author(s). Published by the American Astronomical Society.
Copyright ©
2026 Astronomy Image Explorer. All Rights Reserved.