Image Details
Caption: Figure 1.
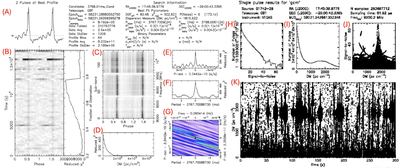
Displayed here is the prepfold output from PRESTO of the GCM, PSR J1745–2900, for the selected observation with a 6 hr integration time. Panel (A): Pulse profile folded at the pulsar rotation period. Two cycles are shown for clarity. Panel (B): Pulse profile as a function of time. Panel (C): Pulse profile as a function of radio frequency. Panel (D): Profile significance as a function of DM. Panel (E): Profile significance across period derivative. Panel (F): Profile significance across period. Panel (G): Profile significance across period and period derivative. Panel (H): Distribution of the signal-to-noise across detected pulses. Panel (I): Number of pulses across trial DMs. Panel (J): Signal-to-noise across trial DMs for all detected pulses. Panel (K): Single-pulse detections across DMs in the first 300 s of observation. The size of the circle is proportional to the signal-to-noise of the pulse. In Panel (A), there is mild interference present at some times; The distinct vertical dark line that runs across time indicates the radio detection of the magnetar. In Panel (K), interference manifests as pulses at zero DM.
Copyright and Terms & Conditions
© 2026. The Author(s). Published by the American Astronomical Society.