

Image Details
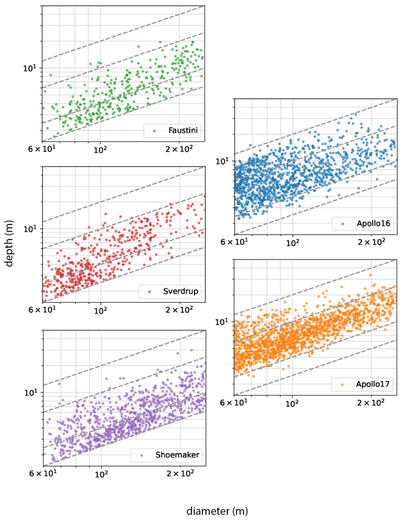
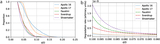
Caption: Figure 4.
Crater depth versus diameter (logarithmic scale) for three PSR regions (Faustini, Sverdrup, and Shoemaker crater floors) and two Apollo landing site areas (Apollo 16 Cayley Plains, Apollo 17 Taurus–Littrow Plains). Dashed gray lines indicate a single d/D value (bottom to top: 0.025, 0.04, 0.10, and 0.20). Axes are equal in size, scale, and limits between subplots.
Other Images in This Article
Copyright and Terms & Conditions
© 2026. The Author(s). Published by the American Astronomical Society.

Copyright ©
2026 Astronomy Image Explorer. All Rights Reserved.
